The Market Monitor
The Market Monitor is a shared space where all public information is displayed for everyone to see. Think of it as a poker table, showing the flow of the game, the size of the pot, and the community cards. It consists of three key components:
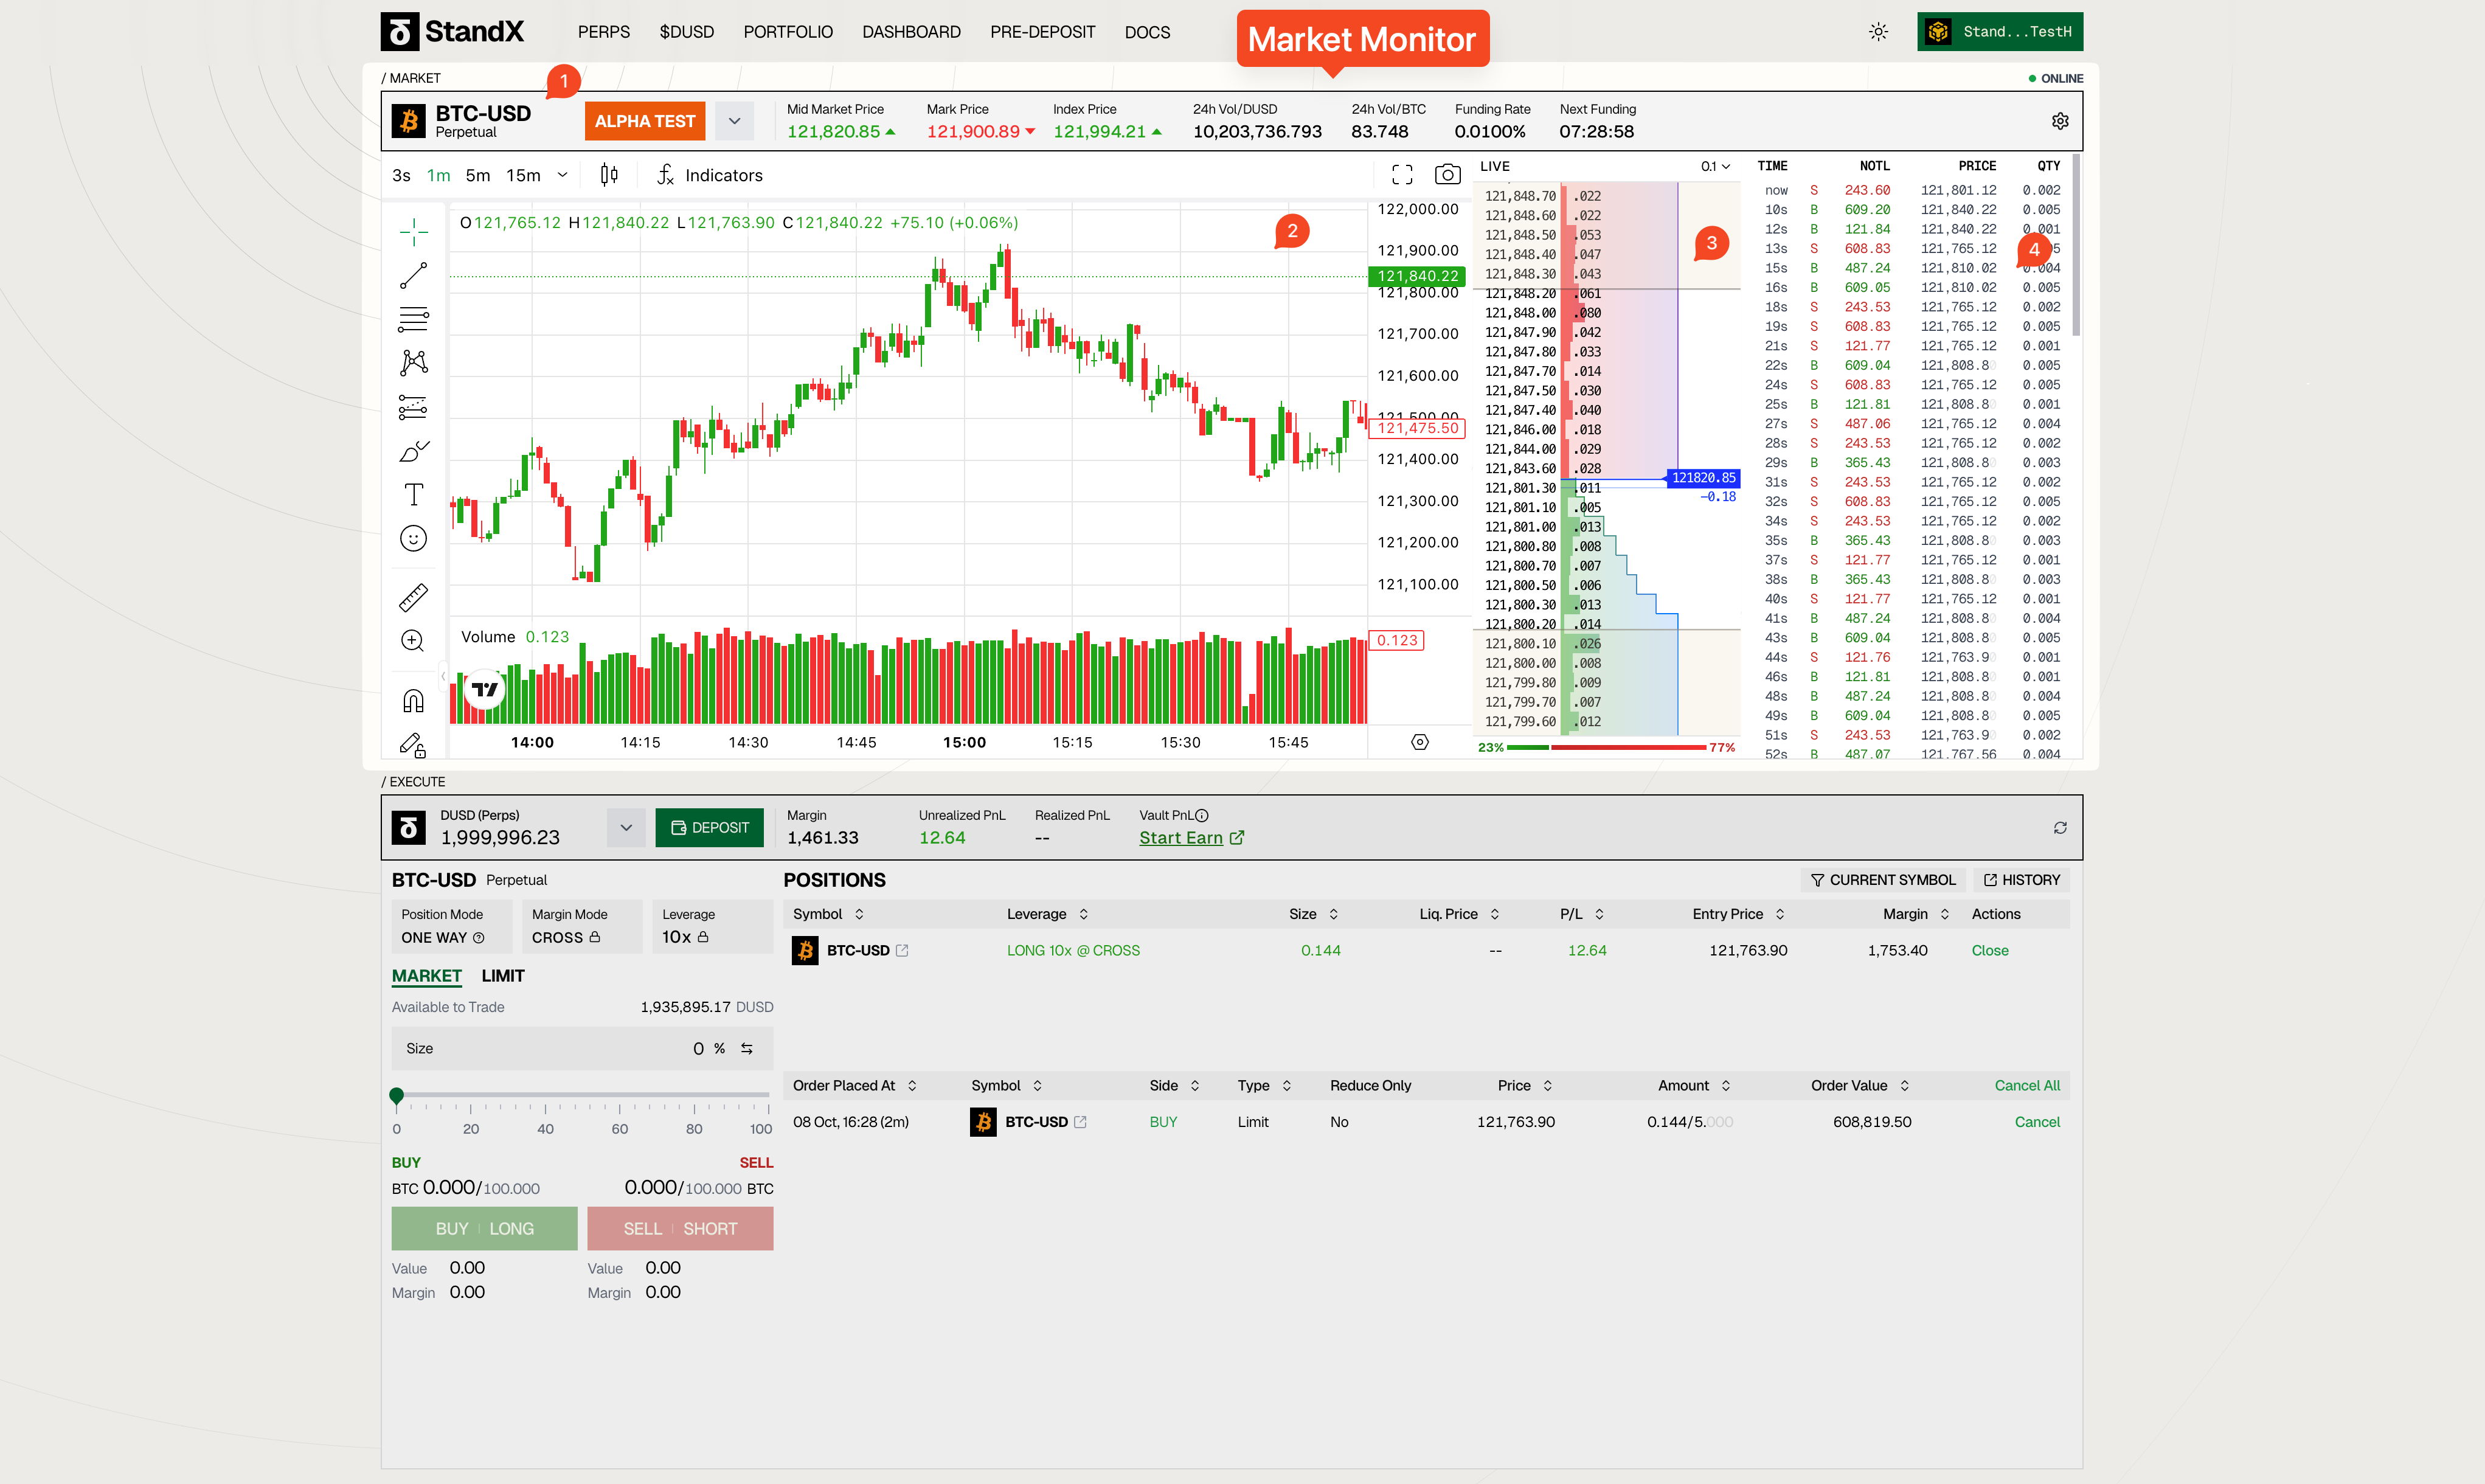
Market K-Line (The Board)
This is the main chart and the centerpiece of the table. It provides a detailed visual representation of the market’s price action.
- Primary View: The large candlestick chart displays the price history for the selected asset (e.g., BTC-USD).
- Timeframe Selection: Traders can instantly switch between various timeframes (e.g., 1m, 5m, 15m, 1H) to analyze short-term trends or long-term market structure.
- Technical Indicators: A dedicated menu allows for the application of various technical indicators to aid in strategic analysis.
Fluid Order Book (Reading the Table)
To the right of the K-Line is our innovative Fluid Order Book. This is not just a static list of numbers; it’s a dynamic and interactive visualization of market depth and liquidity.
- Live Price & Momentum Tracking At the center of the order book, a blue line pinpoints the live spread price. Directly beneath it, a numerical delta shows the immediate price change, giving you a real-time indicator of market momentum and direction.
- Customizable Visual Focus The view is fully customizable using two draggable horizontal lines. By moving these lines, you can define the visual range of the order book, allowing you to zoom in on the most critical price action and filter out irrelevant market noise.
- Scrollable Deep Dive The entire order book is scrollable, enabling you to explore the market’s full liquidity beyond the customized view. This allows you to uncover large hidden orders or significant support and resistance levels deep within the market.
![w-[400px]](/_next/static/media/3770cade2d9c06a6ba2649e156e9b27e.20f453fc.png)
Latest Trades (The Flow of the Game)
Situated next to the Order Book, the Latest Trades feed acts as a live ticker, showing every single trade as it happens.
- Real-time Activity: This feed provides a transparent log of recent transactions, including the time, price, and quantity of each trade.
- Market Pulse: By watching the flow and size of trades, users can gauge the market’s current velocity, aggression, and overall activity level, helping them identify emerging trends.